Custom Radioastronomy Software
Adventures into SDR-RTL
Plan: Map the distribution of hydrogen in the universe using the hydrogen line in the radio spectrum (1.42 MHz).
The first part involved deciding on the data collection pipeline. While waiting for the hardware amplifiers to arrive, I started working on the software.
For Windows PC, there is SDR# and GNU Radio. However, neither offered simple time-synchronized, interval-based recording options for long-term sky surveys, so I decided to create my own solution in the spirit of learning.
I’ve settled on Python for the backend and JavaScript with Vue for the frontend as the GUI. The PySDR library, which is written in C, handles raw data recording (dealing with millions of samples per second). The Python backend manages the scheduled recording of raw IQ data and subsequent analysis.
Phase One: Automated Recording and Bridge Between SDR and GUI
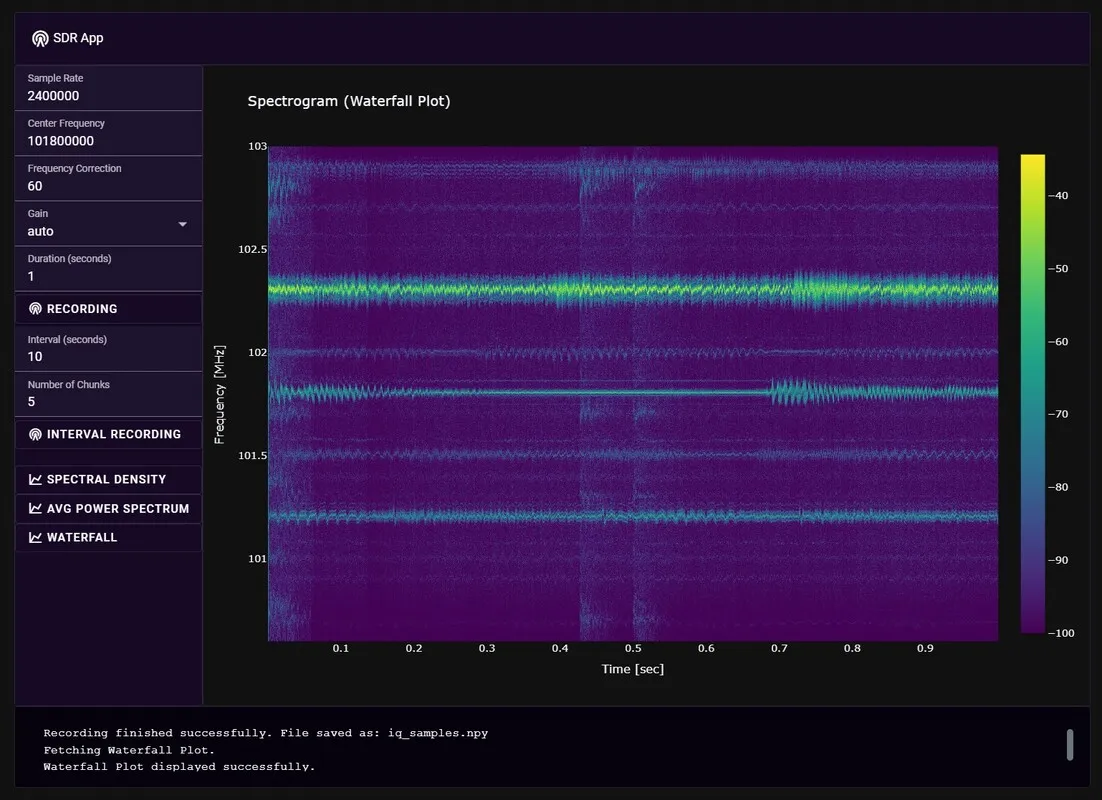
The next step will involve adding functionality specific to recording H-line signals, such as integration over time and finer control in filename naming with the azimuthal coordinate system saved along with the file itself.
Phase II
After some more work on features, I realized I needed much more complex GUI so I moved to PyQT and abandoned the server idea.
Here you can see how PyQT method turned out:
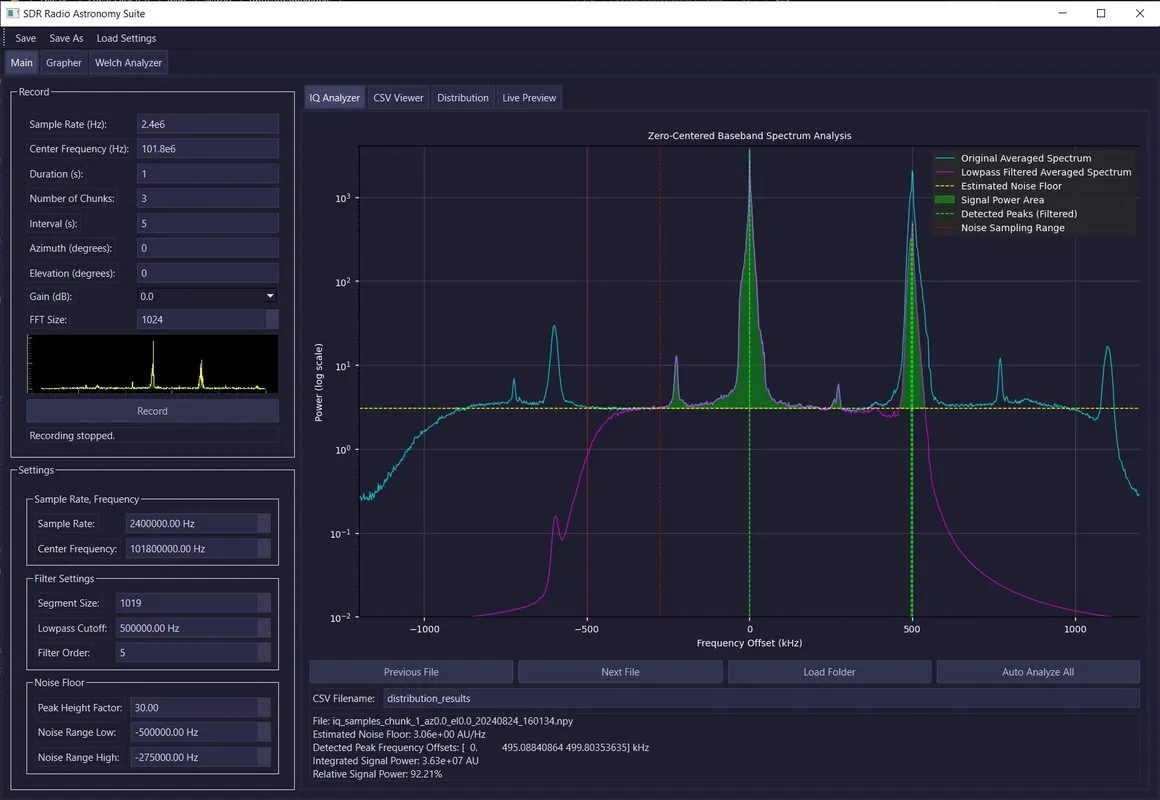
Analysis of signal: settings for: bandpass, average, recording, peak detection, noise floor measurement, relative power measurement, csv processed data export and recording in one tab.
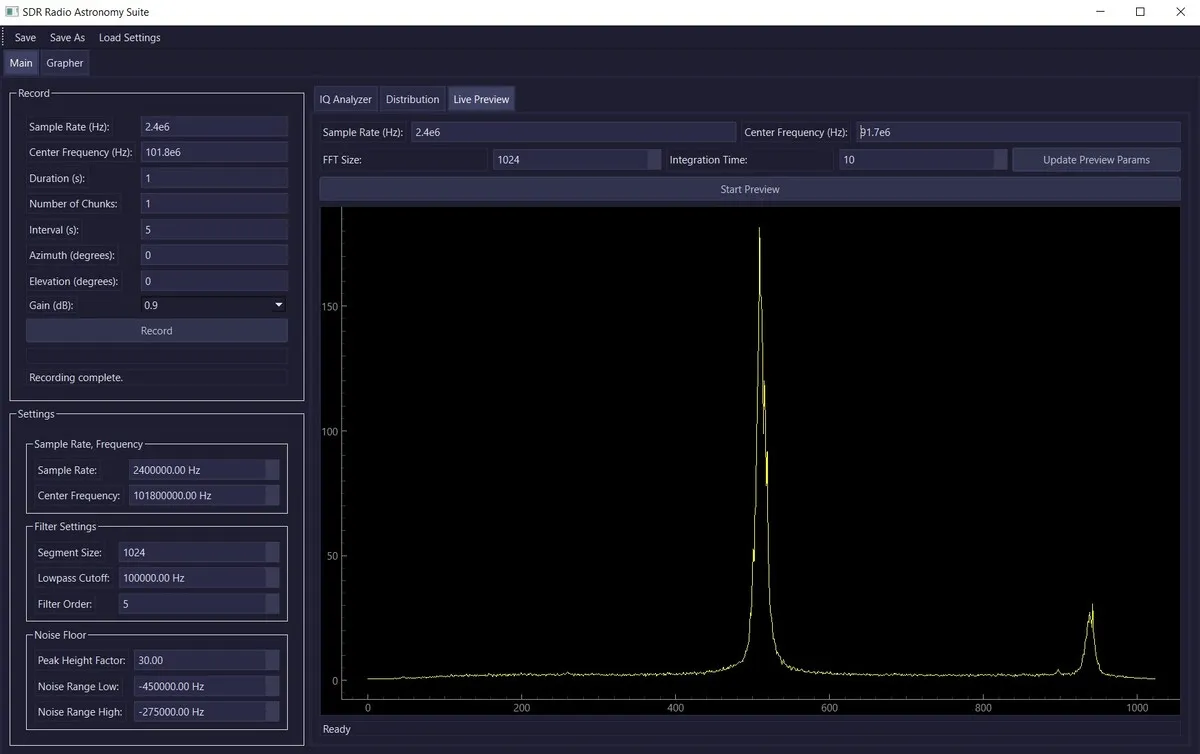
Live preview featurue with IF Average (interpolation over time to increase STN ratio to spot weak signals)
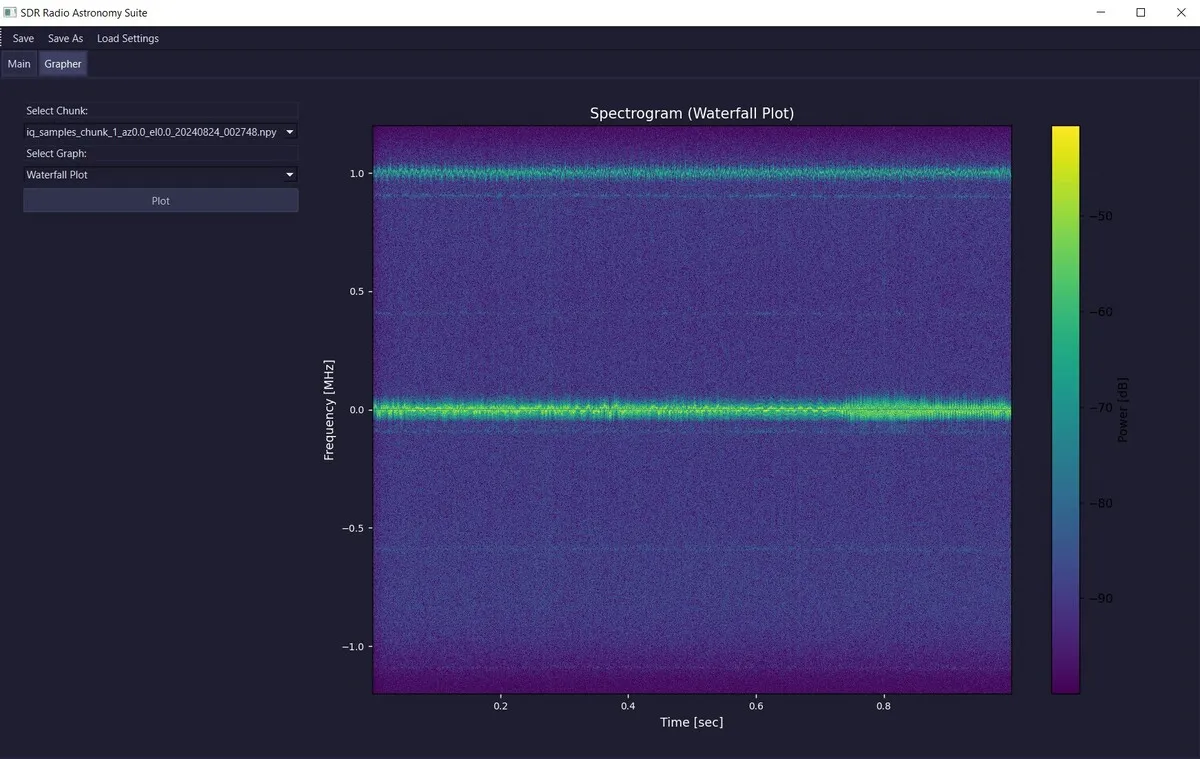
Graphing features to browse recorder data: waterfall, spectral density, average, phase
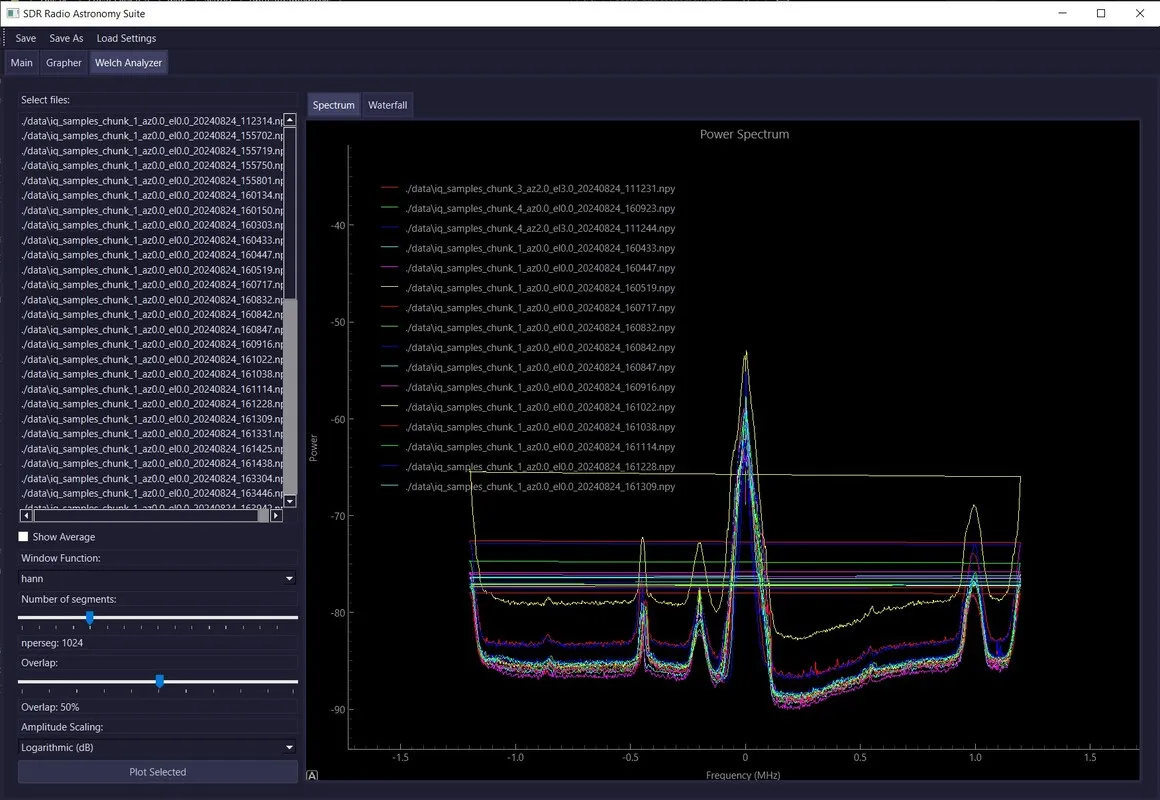
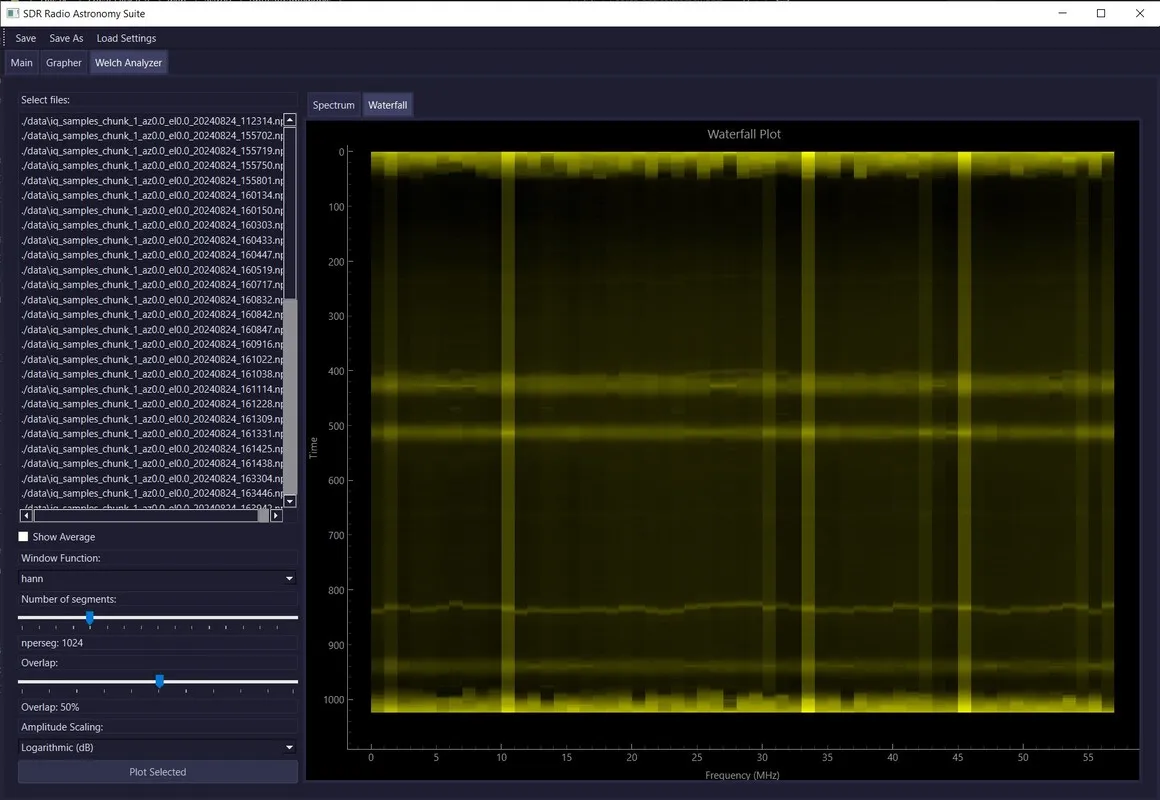 I can also select multiple recorder chunks and run quick analysis on them too, using waterfall graph to look for long time drifts …
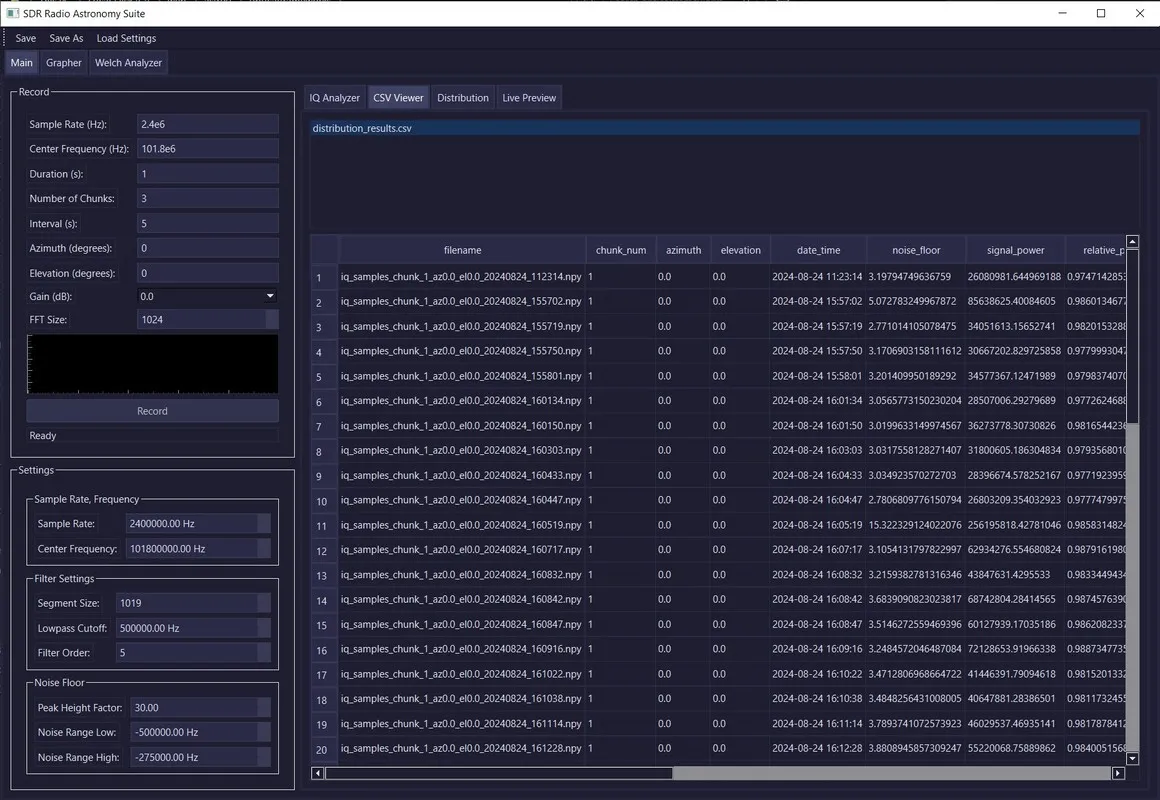
Or browse results of analysis directly in app …
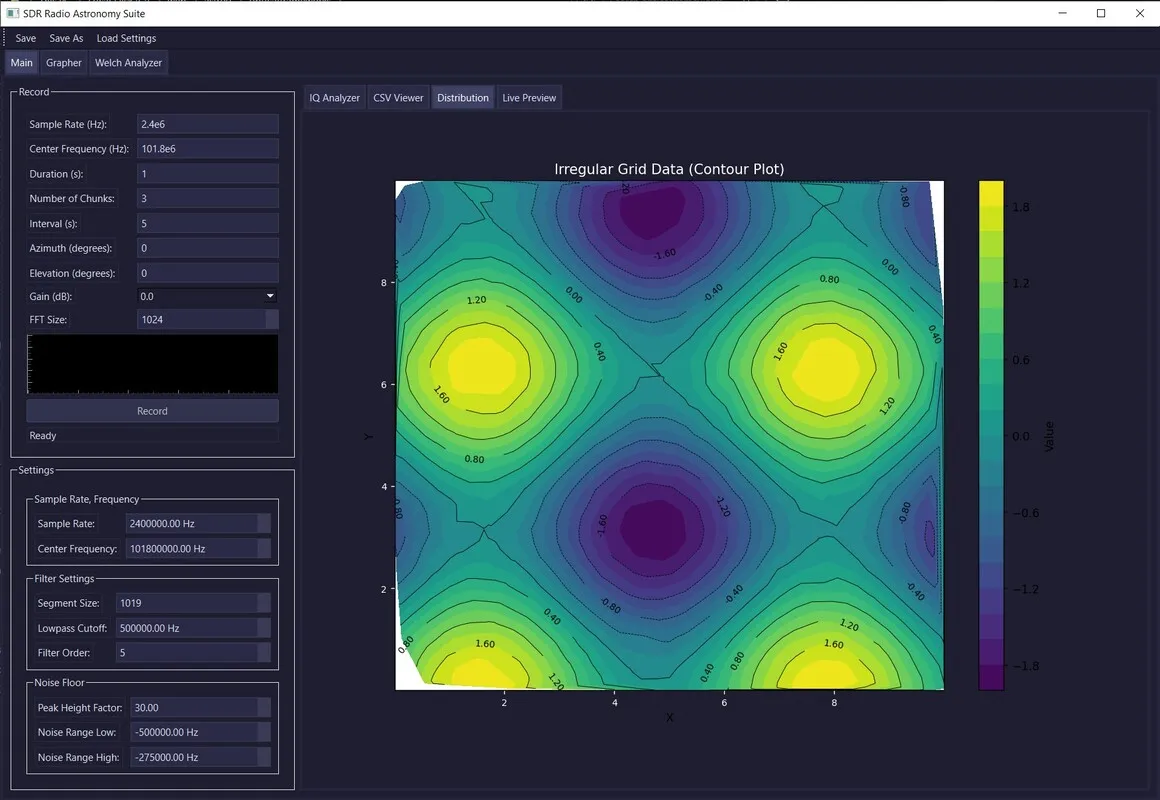
And view final distribution map. (Here only showing foo data) This will be the final output of stage III. (I.e. hydrogen distribution map)
And with this, I am ready to build the antenna. Stay tuned for more.